

Title text:
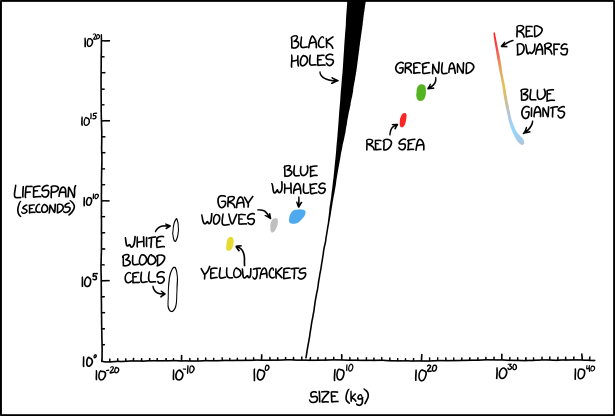
With their 13 years recording and performing together and two humans worth of mass, the White Stripes are sandwiched neatly between gray wolves and blue whales.
Transcript:
Transcript will show once it’s been added to explainxkcd.com
Source: https://xkcd.com/3283/
The linear pattern of the things plotted here weirds me out. Is there really such a clear life-time / size trend? Or were specific things chosen to be listed because they follow a roughly linear trend on the log-log plot?
he’s only plotting things that fit on the trend, log log is very forgiving. but if protins were in there yhey would be far to the left and all the way up higher than stars
Oh, protons! I misinterpreted the typo as proteins.
Somebody already posted the famous phrase in another thread:
You know, I was going to say that tetration or busy beaver numbers would counter that argument, but then again I guess they’d pretty much just look like vertical lines if the stroke weight of the marker was enough to cover the curved behavior around zero.
It’s like the opposite of a smith chart.
I can think of a few counterexamples:
Small dogs live longer than big dogs generally too
The graph has a couple of those “counter examples”.
Those particles are exactly the kind of exception I was looking for. Tiny things that last a long time. The opposite kind of exceptions are probably impossible since making large things takes a lot of time. You would need to have something the size of a galaxy that lasts from Monday evening to Thursday morning.
Checkmate atheists